OdoTrace · Editorial review: . Source dates are stated separately.
Among the 19 published UK 2010 cohorts in this analysis, median odometer readings range from 96,811 km for the Kia Picanto to 217,786 km for the Audi A6. That is a comparison of historical inspection samples, not a ranking of reliability or fraud. The observations are from 2023; they are not estimates of what those cars have driven in 2026.
Why compare the same cohort year?
Age strongly affects accumulated distance. Holding the first-use year at 2010 removes one obvious difference when reading this particular table. It still leaves differences in usage, engines, buyers, model-name grouping and which vehicles survived to an inspection. The results do not isolate a causal effect of model choice.
We selected every 2010 cohort already included in OdoTrace's published UK mileage dataset, rather than choosing only the most striking examples. These rows account for 361,557 recorded inspections/readings; this is not a count of unique cars. It is also not the entire UK fleet.
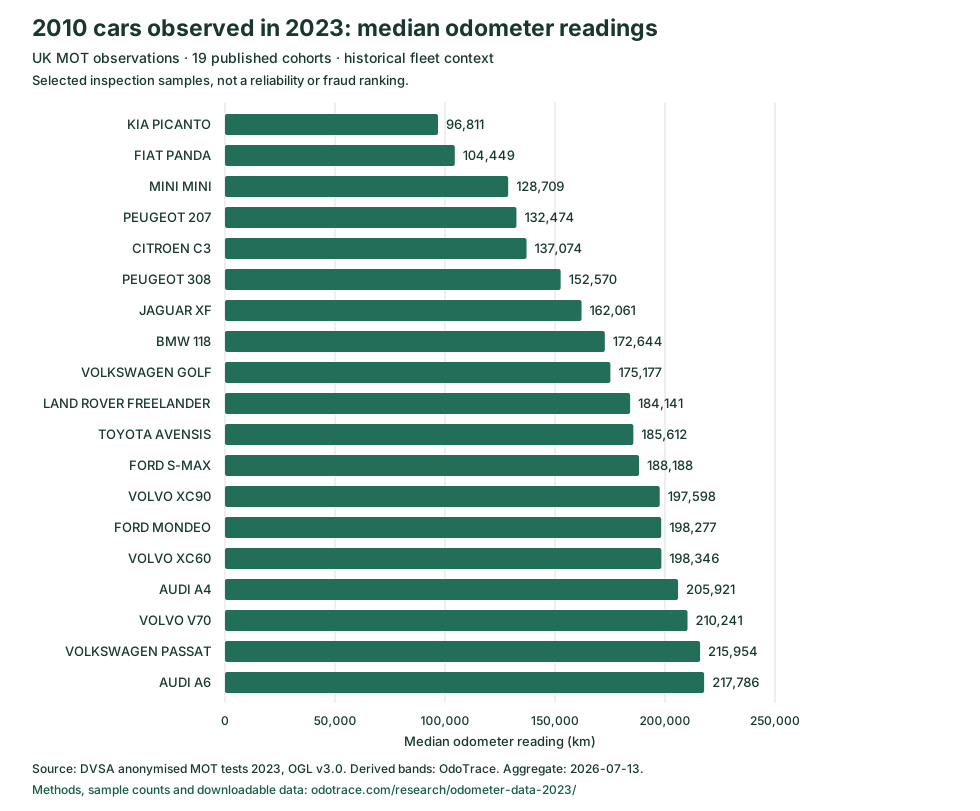
The published 2010 cohort
The 10th–90th percentile span describes the middle part of each sample. It is not a recommended mileage range or a confidence interval. Percentiles are approximate; see the sampling method below.
| Model | Readings | 10th percentile | Median | 90th percentile | 10th–90th span |
|---|---|---|---|---|---|
| Kia Picanto | 17,848 | 43,418 | 96,811 | 164,314 | 120,896 |
| Fiat Panda | 12,190 | 50,290 | 104,449 | 172,959 | 122,669 |
| Mini Mini | 38,716 | 73,930 | 128,709 | 193,372 | 119,442 |
| Peugeot 207 | 39,949 | 74,522 | 132,474 | 205,117 | 130,595 |
| Citroen C3 | 26,993 | 77,971 | 137,074 | 207,849 | 129,878 |
| Peugeot 308 | 18,671 | 90,403 | 152,570 | 232,527 | 142,124 |
| Jaguar Xf | 12,197 | 91,604 | 162,061 | 242,391 | 150,787 |
| BMW 118 | 13,716 | 102,037 | 172,644 | 250,674 | 148,637 |
| Volkswagen Golf | 61,747 | 99,723 | 175,177 | 261,252 | 161,529 |
| Land Rover Freelander | 17,767 | 115,539 | 184,141 | 259,904 | 144,365 |
| Toyota Avensis | 7,615 | 106,136 | 185,612 | 312,397 | 206,261 |
| Ford S-Max | 12,363 | 127,658 | 188,188 | 259,772 | 132,114 |
| Volvo Xc90 | 7,712 | 132,421 | 197,598 | 272,202 | 139,781 |
| Ford Mondeo | 23,095 | 119,976 | 198,277 | 294,821 | 174,845 |
| Volvo Xc60 | 5,418 | 126,278 | 198,346 | 278,002 | 151,724 |
| Audi A4 | 17,098 | 129,961 | 205,921 | 294,694 | 164,733 |
| Volvo V70 | 3,539 | 121,281 | 210,241 | 304,114 | 182,833 |
| Volkswagen Passat | 16,298 | 135,703 | 215,954 | 313,989 | 178,286 |
| Audi A6 | 8,625 | 138,448 | 217,786 | 309,557 | 171,109 |
Download the aggregate table as CSV. It includes the observation year, cohort year, market, sample count, source, licence, generation timestamp and corresponding public model page. It contains no VINs or plates.
What the variation means for a buyer
A single “normal mileage for a 2010 car” threshold would conceal a median difference of 120,975 km between the lowest and highest model cohorts shown here. Even within a model, the 10th–90th percentile span can be broad. Investigate a particular car using dated records, not a verdict inferred from where it sits in this table.
For a concrete follow-up, compare the Audi A4, Volkswagen Golf and Volkswagen Passat pages, then use the individual mileage-history checklist. Model-level Peugeot 208 recalls answer a separate safety question; mileage is not a recall-risk score.
Method, source and reproducibility
- The underlying input is the DVSA anonymised 2023 MOT test-results dataset. OdoTrace's ingestion selects class-4 records with readings from 1 to 500,000 miles, nonempty make and model, and usable first-use dates between 1995 and 2024. The year in this analysis comes from the first-use date; it is not a guarantee of the manufacturer's model-year designation.
- The ingestion groups readings by make, model and first-use year. A group can include repeat tests of the same car. The ingest uses a fixed random seed (20260623). Large groups use a reservoir of up to 12,000 readings to estimate percentiles; the displayed sample count is the accepted reading count, not the reservoir size.
- The published site cohort is curated: each band needs at least 1,000 readings and supporting EU-market context. It is not a random sample of all model cohorts. Lithuanian data and recall counts help select pages but are not mixed into the UK odometer figures here.
- This analysis filters the published aggregate to year 2010, sorts by median kilometres and computes each span as p90 minus p10. It neither pools medians nor infers a fleet-wide percentile. Download the CSV to reproduce the displayed arithmetic.
Source aggregate generated ; observation period 2023; editorial analysis reviewed . The source readings are in miles; published kilometre values use the ingestion conversion factor 1.60934 and whole-number rounding.
Attribution: Driver and Vehicle Standards Agency, anonymised MOT tests and results, used under the Open Government Licence v3.0. OdoTrace calculated the derived bands and this comparison. See the full methodology.
Limits you should preserve when citing this
This is a small selected historical UK cohort, not an EU-wide survey or a measurement of rollback prevalence. We did not deduplicate every vehicle, validate every source reading, calculate uncertainty intervals, or adjust for vehicle survival and use. Different observation years and latest-per-vehicle Lithuanian samples should not be placed in a country league table. A lower odometer value is not proof of fraud, and a higher value is not proof of authenticity.